The short answer
- Is depreciation a fixed schedule?
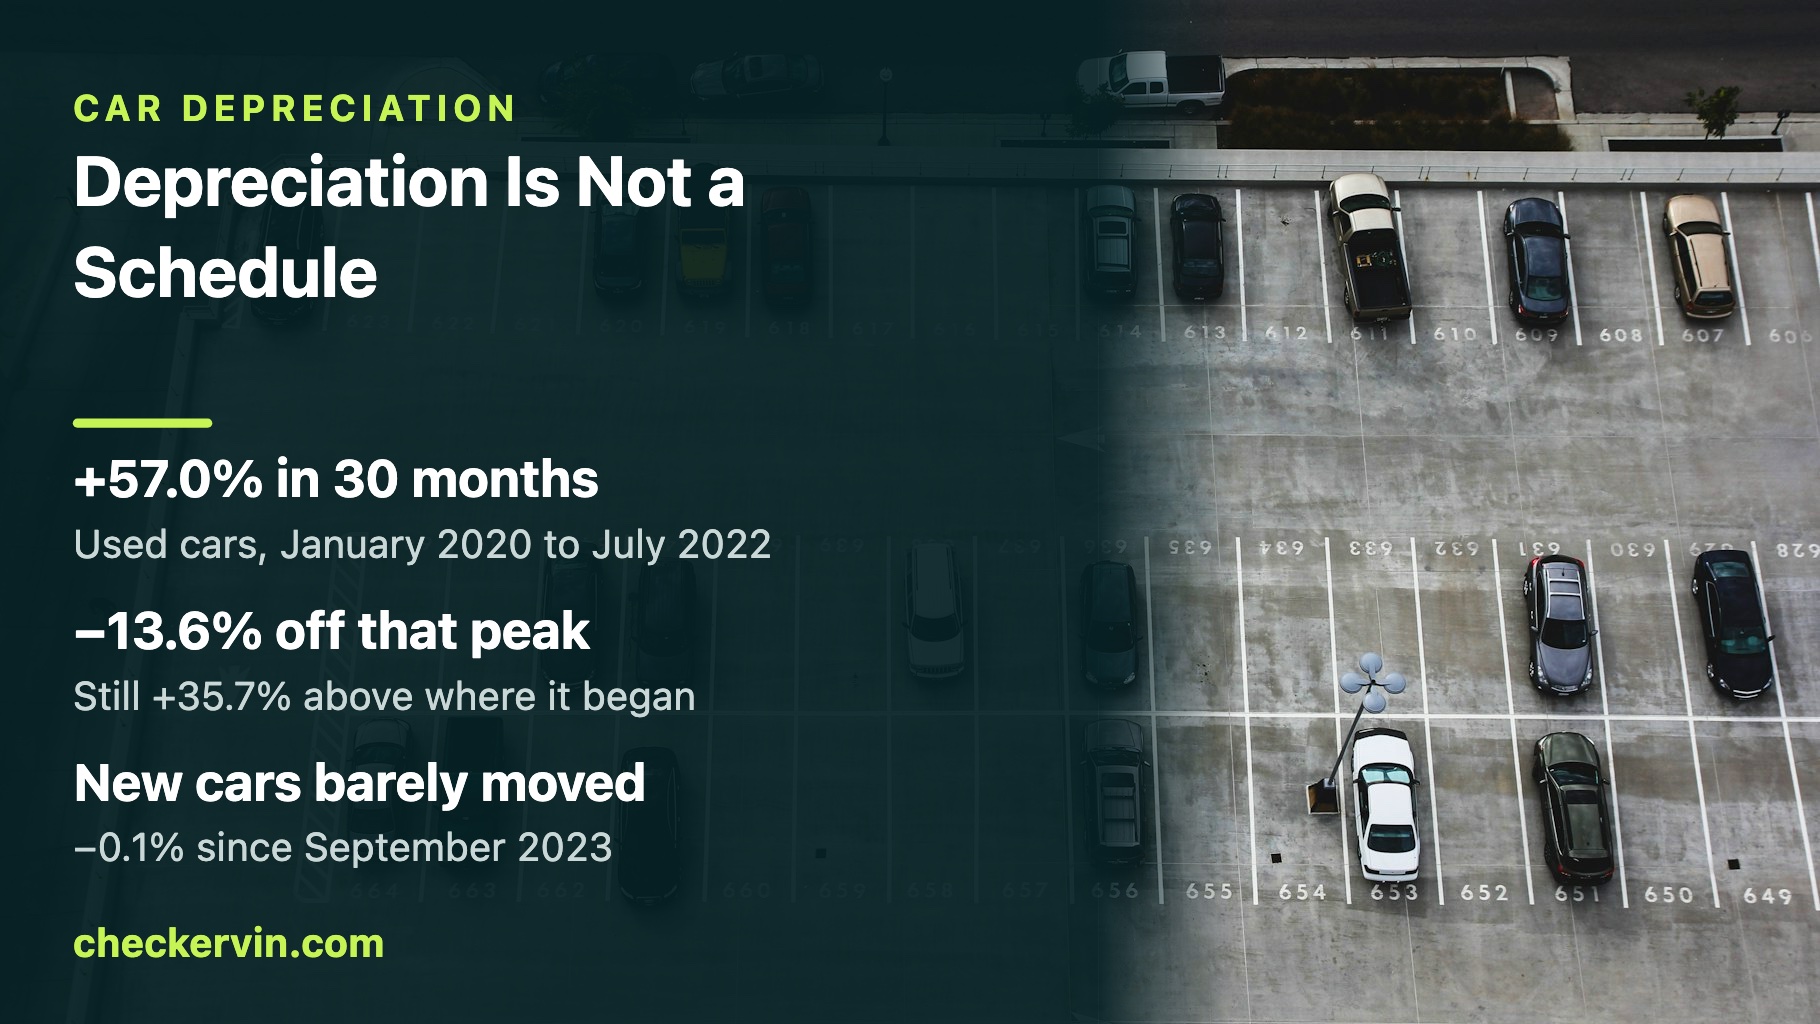
- No, and the public data disproves it. The BLS used vehicle index rose 57% in 30 months from January 2020. An asset on a depreciation schedule cannot do that.
- Where does the government publish car prices?
- In the Consumer Price Index. Series CUUR0000SETA02 covers used cars and trucks and CUUR0000SETA01 covers new vehicles, both indexed to 1982-84 = 100 and both free to download.
- Can a calculator tell me what my car is worth?
- It can tell you what an average vehicle did over an average period. Your car's price is set by its specific condition, mileage, options, local market and reported history, and none of those are inputs to a curve.
57%
Used vehicle prices rose
January 2020 to July 2022
30 months
That the rise lasted
During which the average used car gained value
−13.6%
From the peak since
Where the index sat in July 2026
36%
Still above 2020
The level the market never returned to
What depreciation actually is, and what it is not
Depreciation is the decline in a vehicle’s market value over time. That is the whole definition, and the important word in it is market. Depreciation is not a physical process happening to the car. It is the aggregate of what buyers are willing to pay, and buyers change their minds for reasons that have nothing to do with the vehicle.
This is why the standard framing misleads. A depreciation curve looks like a description of wear — the car gets older, so it is worth less, in a smooth decline you could predict from the day of purchase. What the curve actually is, is a historical average of price observations across many vehicles over a period when nothing unusual happened. It is a summary of the past, dressed as a forecast.
There is a second confusion worth clearing early: tax depreciation is not market depreciation. Businesses write down vehicle assets on statutory schedules that exist to allocate cost across tax years. Those schedules are precise, published and binding, and they have no relationship at all to what your car would sell for. If you have seen a table of depreciation percentages that looked authoritative and governmental, there is a fair chance it was a tax table doing an entirely different job.
The one public price series, and how to read it
There is exactly one free, public, continuously maintained measure of American vehicle prices, and it is part of the Consumer Price Index. The Bureau of Labor Statistics publishes two relevant series:
| Series | What it measures |
|---|---|
| CUUR0000SETA02 | Used cars and trucks, U.S. city average, all urban consumers, not seasonally adjusted — published since 1952 |
| CUUR0000SETA01 | New vehicles, U.S. city average, all urban consumers, not seasonally adjusted — published since 1935 |
Both are indexed so that the 1982–84 average equals 100. An index of 184.7 therefore means used vehicle prices are roughly 1.85 times their early-1980s level in nominal dollars. The absolute number is not the interesting part. The changes are, because they describe how the whole used market moved, month by month, measured the same way every time.
Two things to hold onto when reading it. First, this is an index of prices paid, not of vehicle quality — a car that is one year older is not the same good, so the index is doing statistical work to compare like with like. Second, these particular series are not seasonally adjusted, which the CUUR prefix denotes. Used vehicle prices have a genuine seasonal rhythm, so short comparisons between adjacent months are less meaningful than comparisons across a year or more.
The thirty months that broke the schedule
Here is the fact that ought to appear at the top of every depreciation page and appears on almost none of them.
In January 2020 the used cars and trucks index stood at 136.1. By July 2022 it had reached 213.7. That is a rise of 57% over 30 months. For two and a half years, the average used vehicle in the United States did not depreciate. It appreciated, and substantially.
Anyone who bought a used car in 2020 and sold it in 2022 may well have received more than they paid. That is not a quirk of one model or one region; it is what the national index did. And it is fatal to the premise that depreciation is a schedule, because a schedule cannot produce that outcome under any parameters.
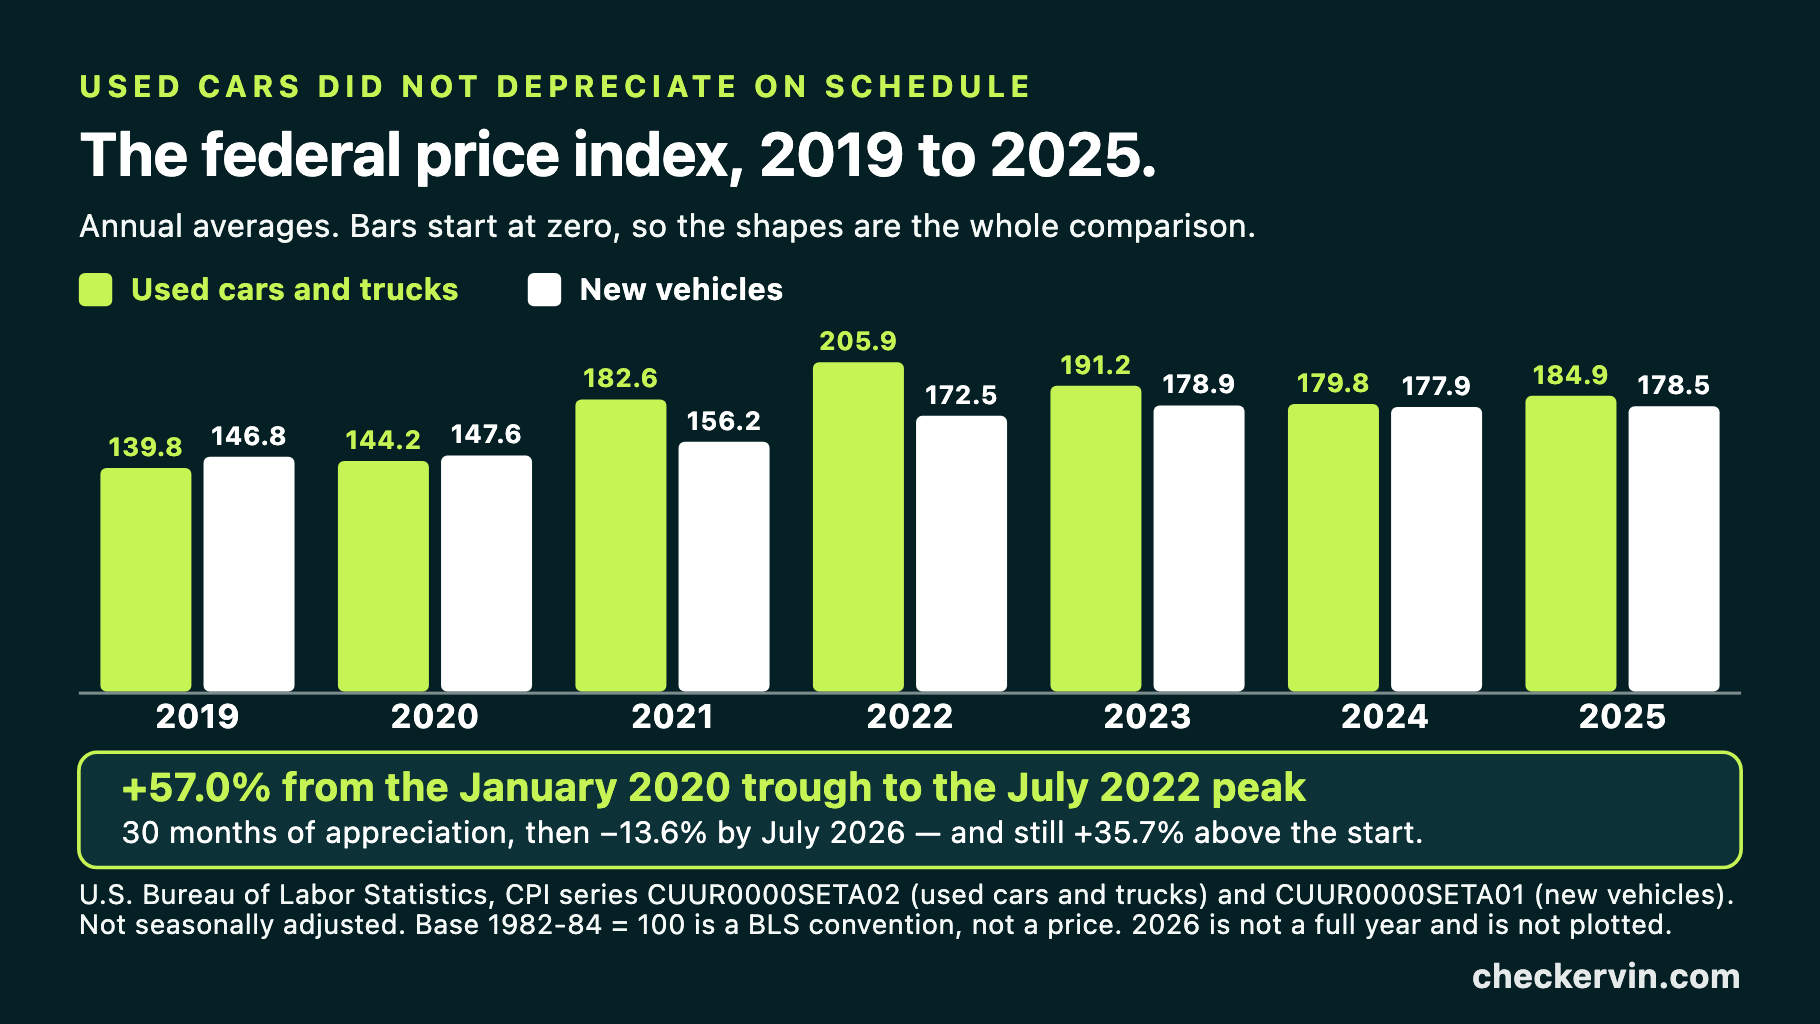
What came afterward matters just as much. From the July 2022 peak the index fell to 175.6 by February 2026 — a decline of 17.8% — and then began climbing again, reaching 184.7 in July 2026. The market gave back part of the spike and stopped. It never returned to 2020 levels; the latest reading is still 36% above where the run began.
| Point in the series | Used cars and trucks index |
|---|---|
| January 2020 | 136.1 — the pre-spike trough |
| July 2022 | 213.7 — the peak, 57% above the trough |
| February 2026 | 175.6 — the low since, 17.8% off the peak |
| July 2026 | 184.7 — the latest published, still 36% above the trough |
New and used vehicles do not behave the same way
Run the same period through the new vehicle series and you get a different picture entirely, which is itself informative about what drives used prices.
| Year | Used index / new index, annual average |
|---|---|
| 2019 | 139.8 used · 146.8 new |
| 2020 | 144.2 used · 147.6 new |
| 2021 | 182.6 used · 156.2 new |
| 2022 | 205.9 used · 172.5 new |
| 2023 | 191.2 used · 178.9 new |
| 2024 | 179.8 used · 177.9 new |
| 2025 | 184.9 used · 178.5 new |
The new vehicle index moved from 146.8 in 2019 to 178.5 in 2025 — a steady climb with no year of dramatic movement. It peaked at 179.8 in September 2023 and sat at 179.5 in July 2026, essentially flat, −0.1% from its high.
The used series over the same span went up 57%, down 17.8%, and partway back up. The two markets are connected but they are not the same market, and the used one is far more volatile. That volatility is the reason a depreciation curve fitted to one decade cannot be trusted in the next.
The twenty percent claim, and where it comes from
The most repeated sentence in this entire subject is that a new car loses about twenty percent of its value the moment it leaves the dealership. We went looking for the source. There is not one.
It does not appear in a Bureau of Labor Statistics publication, a Federal Trade Commission consumer document, a Federal Reserve release, or any other government text we could find. Every page that states it either cites nothing or cites another page that states it. It is a number that circulates entirely on its own authority.
That does not make the underlying idea wrong. There genuinely is an immediate gap between what you pay and what you could sell for, and its cause is straightforward: you bought at a retail price that included the dealer’s margin, the finance and insurance products and the taxes and fees, and you would resell into a wholesale market that pays none of those. The gap is real and it is instant. What is not established is that it equals twenty percent, for your car, in this year, in your market.
We are going to keep saying this in different forms because it is the point of the page: a number without a source is not data, however confidently it is set in bold. Elsewhere on this site the same discipline produces the same result — no government body publishes a consistent total-loss threshold table, and no agency publishes the resale-loss figures that diminished value calculators quote either.
Why a curve cannot tell you the price of one car
Suppose the average curve were accurate. It still could not price your vehicle, and it is worth being precise about why.
- 1An average is not a prediction about a memberA national index describes the aggregate of millions of transactions across every model, region and condition. Your car is one observation. Knowing the mean of a distribution tells you very little about any individual draw from it, and vehicle prices have an extremely wide distribution.
- 2The curve has no input for conditionTwo identical model-year vehicles with identical mileage can differ in price by thousands based on maintenance, interior condition, tires, and whether the paint matches on every panel. None of that enters a percentage-per-year formula.
- 3The curve has no input for historyA reported accident, a branded title, an odometer discrepancy or an auction record changes what a buyer will pay. These are the largest single-vehicle effects in the whole subject and no curve models them.
- 4The curve has no input for the market you are inRegional demand, fuel prices, weather, and what is sitting unsold on nearby lots all move the number. A national index averages these away by design.
- 5The curve assumes the future resembles the fitted periodThe thirty months from early 2020 are the proof that it need not. Any curve fitted before 2020 was wrong about the following two years by a very large margin.
What actually moves the value of one specific car
If the curve is the wrong tool, what is the right list? These are the factors that demonstrably change what a specific vehicle sells for, ordered roughly by how much control you have over them.
- Reported damage history — the single largest discrete effect, because it is disclosed to every subsequent buyer and never expires
- Title brand — salvage, rebuilt, flood, lemon: a permanent mark that changes the pool of buyers and lenders willing to touch the car
- Odometer reading and its consistency across recorded disclosures, which is why a gap in the mileage record matters more than the mileage itself
- Mechanical condition and service history, the part a pre-purchase inspection is for
- Trim, drivetrain and factory options, which is what the VIN encodes and where two apparently identical cars diverge
- Local demand for that body style, which no national figure captures
- The state of the used market overall — the factor the price index measures and the one nobody controls
Notice that the first three are all record effects rather than physical ones. A repaired car and an undamaged car can be mechanically identical and still price differently, because the market is not bidding on the metal. It is bidding on what it knows.
The record, and the one federal number attached to it
Since record effects dominate, it is worth knowing what the federal government has actually documented about them — which is less than you would expect, and more specific than you would expect where it exists.
On odometer fraud, NHTSA’s 2019 rulemaking states that there are about 190,000 cases annually with a loss of $761,000,000, which the agency characterizes as an average of about $4,000 per case. The arithmetic on those two figures gives $4,005, so the $4,000 is a rounded statement of the same thing. The rule adds that 60% of rollbacks occurred in vehicles 11 to 19 years old and that the average rollback is about 50,000 miles.
On title washing, the Department of Justice rule establishing the national title database recorded more than 185,000 titles that were branded in one state and then re-titled in a second state in a way that produced a purportedly clean title — in the first six months of 2008 alone, and again attributed to a private data company rather than measured federally.
Both numbers are old. Both are vendor figures inside government documents. They are the best available, and describing them accurately is more useful than upgrading them to something they are not. Our pages on odometer rollback checks and title washing go through the mechanisms in detail.
Check any VIN free
Decoded from official manufacturer and NHTSA records
Estimating depreciation honestly, without a curve
You can get a defensible answer. It just does not come from a formula.
- 1Establish what the car is, exactlyTrim, engine, drivetrain and factory equipment, from the VIN rather than from the listing. Two cars with the same nameplate and year can be different products with different markets.
- 2Pull the record before anything elseReported damage, title brands and odometer history are the largest single-vehicle price effects. Establish them first, because everything downstream is conditional on them.
- 3Find comparable listings, not averagesSame year, same trim, similar mileage, same region, priced this week. Asking prices are not transaction prices, but a spread of them brackets the market better than any national figure.
- 4Get a written offerA dealer or online buyer will put a number in writing. That number is what the wholesale market actually pays for your car today, which is the only figure with money behind it.
- 5Use the index for direction, not for levelThe BLS series tells you whether the used market as a whole has been rising or falling since you bought. That is real information about timing, and it is the appropriate use of an aggregate.
The gap between step three and step four is the retail-to-wholesale spread the twenty percent folklore is gesturing at. Measuring it for your own car takes an afternoon and gives you a real number instead of a quoted one.
When depreciation actually costs you something
Depreciation is an accounting fact until a specific event converts it into a bill. There are three of those, and they are the moments worth planning around.
| The moment | How depreciation converts into money |
|---|---|
| You sell or trade in | The difference between what you paid and what you receive becomes real. Until this point it is a number on a screen |
| The car is totaled | The insurer pays actual cash value, which is the depreciated figure — not what you paid, and not what a replacement costs |
| You owe more than it is worth | Negative equity. The loan balance falls on a schedule; the car's value does not, and the gap has to be paid from somewhere |
The third is where the two halves of this site meet. A longer loan term reduces the monthly payment and slows the rate at which the balance falls, while the vehicle’s value moves on its own terms — which is why the arithmetic on our car loan calculator page matters here. The second is why total loss thresholds are worth understanding before you need them.
How long cars actually last now, and why that matters
One structural change sits underneath everything above: vehicles last far longer than the depreciation folklore assumes.
The Department of Energy’s Transportation Energy Data Book put the average age of light vehicles in operation at 12.1 years in 2020, rising steadily through the preceding decade. A fleet with that average contains an enormous number of vehicles well past any curve’s useful range — and a curve that asymptotes toward zero is describing something that does not happen, because a fifteen-year-old car in running condition has a floor price set by what it can still do.
The practical consequence is that late-life depreciation is much flatter than early-life depreciation, and that a car’s remaining useful life is a bigger determinant of its price than its age. That is why the mileage question has no fixed answer either.
What this page cannot tell you
Three honest gaps, stated rather than papered over.
We cannot tell you what your car will be worth in three years. Nobody can, and the 30 months from January 2020 are the proof. Anyone producing that figure is extrapolating an average and presenting it as a forecast.
We cannot give you a percentage for what an accident costs. No federal agency publishes one. The mechanism is documented and the magnitude is not, and we would rather say that than print a figure from a valuation company as though it were data.
We cannot source the twenty percent claim. We looked. If it has a primary source, we could not find it, and we are not going to repeat it on the strength of how many other pages do.
Where this information comes from
- BLS Consumer Price Index — used cars and trucks (CUUR0000SETA02)The used vehicle price series, monthly since 1952, index 1982-84 = 100, not seasonally adjusted
- BLS Consumer Price Index — new vehicles (CUUR0000SETA01)The new vehicle series on the same base, for the comparison drawn above
- BLS public data APIHow the monthly observations quoted on this page were retrieved
- NHTSA final rule — odometer disclosure requirements, 2 October 2019Docket NHTSA-2019-0089. The 190,000 cases, the $761,000,000 annual loss, and the 11 to 19 years concentration
- DOJ final rule establishing NMVTIS, 30 January 2009The 185,000 washed titles recorded in the first half of 2008
- DOE / Oak Ridge — Transportation Energy Data BookTable 3.13, average vehicle age: 12.1 years in 2020, sourced from a private data vendor
Keep reading
Frequently asked questions
Do cars really lose 20% of their value the moment you drive off the lot?
We could not find a primary source for that figure anywhere. It appears on hundreds of commercial pages and traces to none of them. What is documented is that the gap between a retail purchase price and a wholesale resale price is real and immediate, because you bought at retail and would sell at wholesale. The size of that gap is not a published constant.
How much does a car depreciate per year?
There is no fixed answer, and the federal price data shows why. The BLS index for used cars and trucks rose 57% between January 2020 and July 2022. During those thirty months the average used vehicle appreciated. Any per-year percentage is an average over a period, not a rule the market follows.
Is there a government car depreciation calculator?
No. No federal agency publishes vehicle depreciation curves or resale values. What the government publishes is a price index measuring how used vehicle prices move in aggregate, which tells you about the market rather than about your car.
How much value does an accident take off a car?
No federal agency publishes a figure, and we will not invent one. What is documented is the mechanism: the damage reaches a record, the record reaches the next buyer, and the buyer prices it in. The size of the discount depends on the car, the severity, the disclosure and the local market.
Does high mileage or old age matter more?
Both are priced, and they are not independent. NHTSA's odometer rulemaking notes that 60% of rollbacks occurred in vehicles 11 to 19 years old — fraud concentrates where mileage is doing the most work on price, which is on older vehicles where the model year no longer distinguishes anything.
Are used car prices back to normal?
Not to their 2020 level. In July 2026 the index stood at 184.7 against 136.1 in January 2020 — still 36% above where it started, after falling 18% from the peak.
Price the record, not the average
Decode any VIN free for the build, the open recalls and where to check the damage history. No account, no card.
Run a free VIN check