The short answer
- Is there a number?
- No. And the most-cited public dataset on vehicle problems cannot produce one, because it holds no mileage field — only dates.
- So what should I look at?
- Age against use. At 10,812 average miles a year, the odometer mostly tells you how old the car is — which you already knew from the title.
- When does the number matter?
- When it disagrees with the car. Mileage far below the average for the model year is the classic signature of a rolled-back odometer.
0
Mileage fields in the complaint record
Date of incident, no odometer
10,812
Average miles per year
FHWA 2024, light duty short WB
4.6 yrs
Median age of the top complaint
Across 73 model years
88,715
Dated records behind the table
NHTSA complaints, by component
The honest short answer
There is no mileage figure that separates a good used car from a bad one, and anyone who gives you one is describing a habit rather than a finding. That much every page on this subject agrees on. What none of them do is explain why the number fails, and the explanation is more useful than the disclaimer.
Mileage fails because it is a proxy for two different things at once — how much a car has been used, and how long it has existed — and the second is doing most of the work. When those two come apart, as they do on a garage-kept commuter or a two-year-old rental, the odometer stops predicting anything. The rest of this page is what the public records say once you stop using the proxy and look at the thing it stands for.
The largest record of car problems does not record mileage
The National Highway Traffic Safety Administration runs the complaint database that almost every reliability story in America is ultimately built on. Any member of the public can query it. A single popular model year returns well over a thousand records, each one an owner describing something that went wrong.
Every record carries the same fields: a complaint number, the manufacturer, whether there was a crash or a fire, injuries, deaths, the date the incident happened, the date the complaint was filed, the components involved, and the owner’s narrative. There is no mileage field. There is no odometer field. Not blank, not optional — absent from the structure.
That is worth sitting with. The federal government collects, at scale, what breaks on American cars, and it does not ask how far the car had gone. It asks when. Owners sometimes type a mileage into the free-text summary, but nothing counts it, so nothing can be computed from it. The record is organized on the calendar because the calendar is the axis the agency can actually use.
When each part actually draws complaints
Because the records carry dates, they can be turned into something the mileage question cannot produce: the age at which each part of a car starts generating complaints. Below, every component is dated against its vehicle’s model year and the median taken, pooled across 73 model years from 2008 to 2022. The second figure is the share of that component’s reports that arrived within the first three years — a measure of how front-loaded the trouble is.
| Component | Median age when owners report it |
|---|---|
| Engine | 5 years — 24% of its reports came in the first three years, across 71 model years |
| Electrical system | 4.8 years — 31% of its reports came in the first three years, across 73 model years |
| Power train | 4.4 years — 33% of its reports came in the first three years, across 70 model years |
| Service brakes | 4.2 years — 39% of its reports came in the first three years, across 71 model years |
| Steering | 4.7 years — 33% of its reports came in the first three years, across 62 model years |
| Air bags | 4.3 years — 34% of its reports came in the first three years, across 65 model years |
| Structure | 3.7 years — 42% of its reports came in the first three years, across 64 model years |
| Fuel / propulsion system | 5.2 years — 24% of its reports came in the first three years, across 65 model years |
| Vehicle speed control | 4.2 years — 42% of its reports came in the first three years, across 63 model years |
| Exterior lighting | 4 years — 35% of its reports came in the first three years, across 48 model years |
The pattern is not subtle. The expensive mechanical components — engine, powertrain, electrical — cluster in the fifth and sixth year of a vehicle’s life, not the twelfth. Across the whole set, the single most-reported component on a given vehicle draws its complaints at a median age of 4.6 years, and on 49 of the 73 model years that median falls under six.
Three ways this table could mislead you, stated plainly
Any number presented this confidently deserves its limits printed next to it, so here are the three that matter.
- Model year is a proxy for the sale date, not the sale date itself. A car sold in late 2015 as a 2016 model reads a few months older here than it was.
- Complaints are self-selected. People file when something is bad enough to bother, which means the database over-represents dramatic faults and under-represents slow wear.
- One complaint can name several components, so a component's report count is a count of tags rather than of complaints. The totals here are tag counts, deliberately labeled as such.
- A recent model year has had less time to accumulate reports, so the newest years in any extract look calmer than they will eventually prove to be.
The average year is lower than the number everyone repeats
The standard rule of thumb holds that a car covers 12,000 to 15,000 miles a year, and that any car above that line is “high mileage.” The Federal Highway Administration publishes the actual figure, and it is lower than that.
Table VM-1 of Highway Statistics reports total travel and registered vehicles by category, and publishes the division itself as “average miles traveled per vehicle.” For light duty vehicles with a short wheelbase — the cars, crossovers and small SUVs most people are shopping for — the 2024 edition gives 10,812 miles per vehicle per year, across 205,550,881 registered vehicles.
One practical note on sourcing, because it caught us out. The figures are not in the HTML of the VM-1 page at all — that page is navigation and footnotes. They live in the spreadsheet linked from it, and the current edition is stamped Updated: February 2026. If you are checking this yourself, open the workbook rather than reading the page.
That gap matters because the rule of thumb is used as a test. Judge a car against 15,000 miles a year and a great many perfectly ordinary vehicles look suspiciously low-mileage; judge it against 10,812 and the same cars look normal. If you are going to do this arithmetic at all, do it against the published number.
The average, by vehicle class — and one reversal
The single figure is the one everybody quotes, but the table publishes a whole column, and the spread across vehicle classes is wider than the debate about used cars ever suggests.
| Vehicle class | Average miles per vehicle, 2024 |
|---|---|
| Light duty, short wheelbase — cars, crossovers, small SUVs | 10,812 |
| Light duty, long wheelbase — larger SUVs and pickups | 10,707 |
| All light duty vehicles | 10,787 |
| Single-unit trucks | 10,880 |
| Buses | 16,494 |
| Combination trucks | 55,276 |
| Motorcycles | 2,401 |
| All motor vehicles | 11,071 |
A combination truck covers more than five times what a car does; a motorcycle covers about a fifth. Neither is surprising, and both are useful if you are valuing something other than a sedan — a motorcycle showing 20,000 miles is not the equivalent of a car showing 20,000 miles, and reasoning about one from the other is a category error people make constantly.
We are not going to call that a trend. Two editions of an estimate that swap places by a few hundred miles are better read as saying the gap between the two classes is small and not stable. What it does settle is the folk claim that trucks and large SUVs systematically cover far more ground than cars — at the national level, in these two years, they do not.

The number moves every year, which is the point
The previous version of this page cited the 2023 figure of 11,026 miles. That was correct when it was written. The 2024 edition puts it at 10,812 — about 1.9% lower.
That matters more than the size of the change. An average annual mileage is an estimate rebuilt every year from state-reported travel data and registration counts, and it drifts. A rule of thumb pretends otherwise: “12,000 miles a year” has been repeated unchanged for decades, through fuel prices, recessions and a pandemic that moved actual travel enormously.
| Edition | Miles per light-duty short-wheelbase vehicle |
|---|---|
| 2023 | 11,026 |
| 2024 | 10,812 |
| The rule of thumb | 12,000 to 15,000, unchanged |
The reason it fell is worth a paragraph, because it is the opposite of what the direction suggests. Total travel by this class of vehicle went up between the two editions, from 2,173,555 million vehicle-miles to 2,222,415 million — a rise of 2.2%. The registered fleet went up too, from 197,134,299 vehicles to 205,550,881, a rise of 4.3%.
That is a useful thing to hold onto when somebody tells you what a normal year’s driving is. The figure is not a statement about how much people drive; it is total travel divided by how many vehicles are registered, and vehicles that barely move are in the denominator alongside the ones doing thirty thousand a year.
If you use the arithmetic on this page a year from now, check the current edition rather than trusting the figure printed here. The link is in the sources at the bottom, and the workbook is one click from it.
What 100,000 miles really means
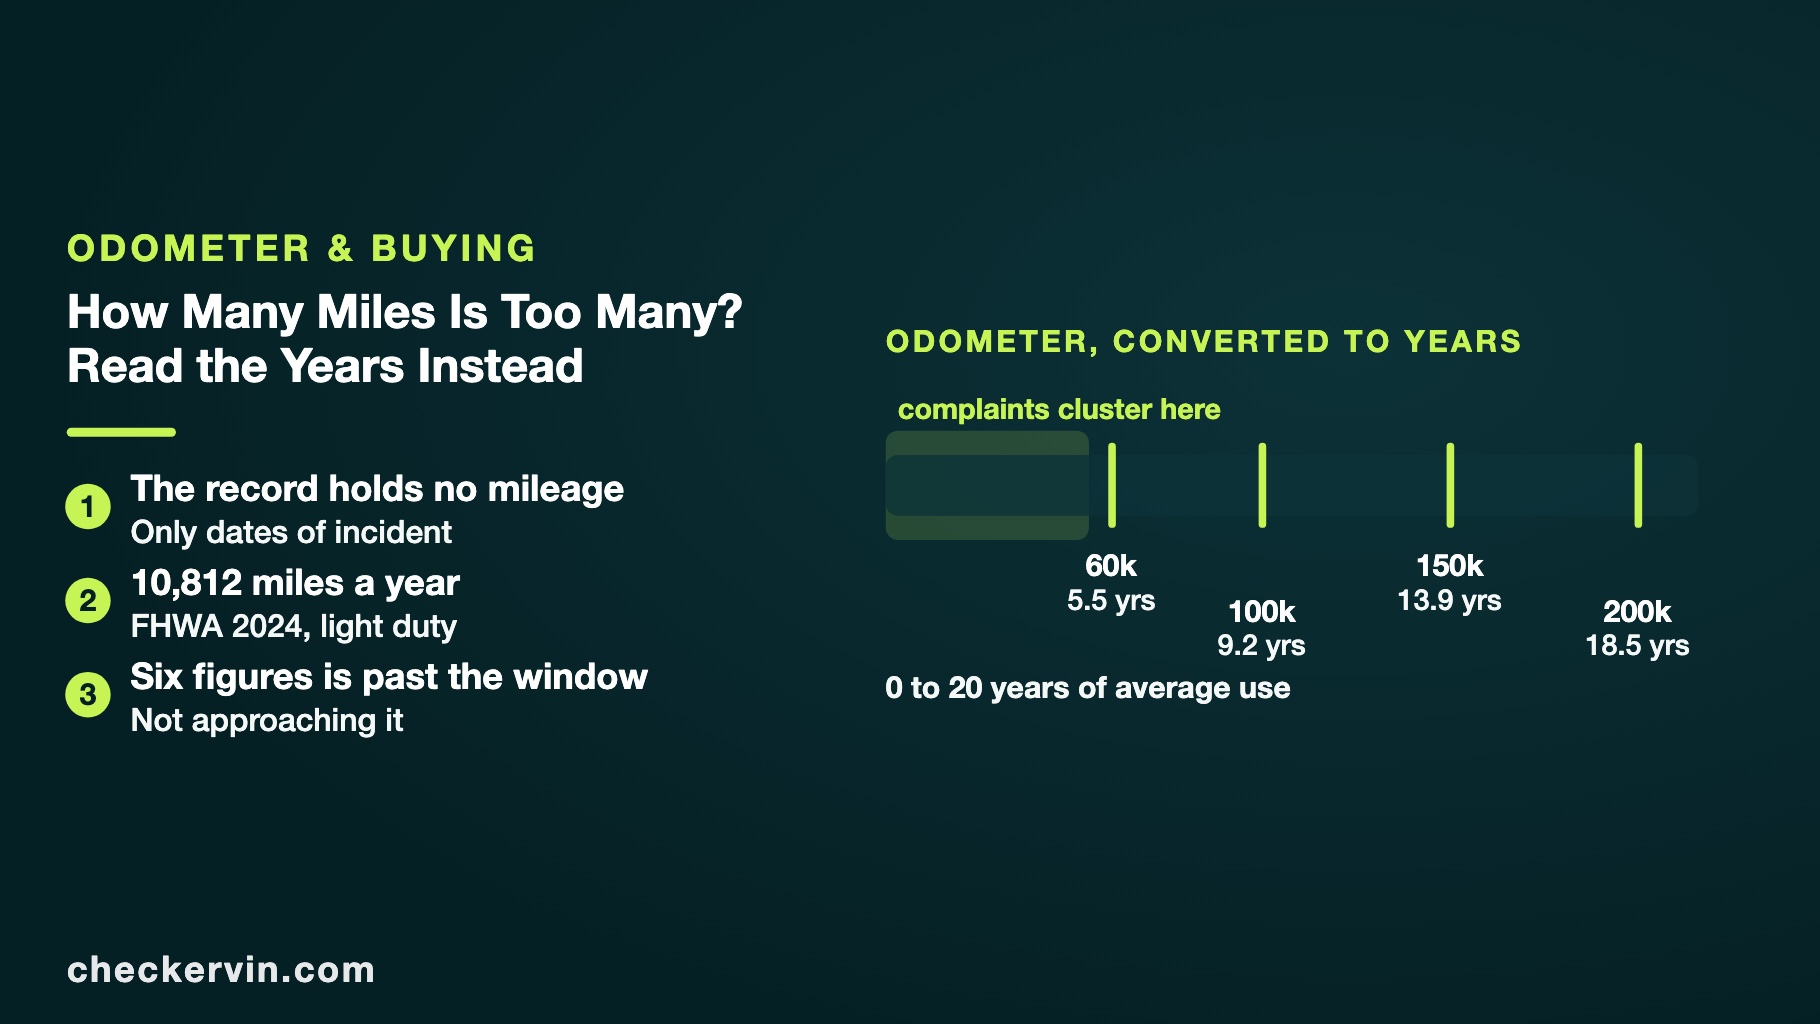
Put the two figures together. At 10,812 miles a year, a car showing 100,000 miles has been on the road about 9.2 years. The median age at which the worst-reported component on a vehicle draws its complaints is 4.6 years.
The same division works at any reading, and it is worth having in front of you because it converts a number that feels alarming into one you can compare against the age evidence:
| Odometer reading | Years of average use, at 10,812 a year |
|---|---|
| 60,000 miles | 5.5 years — past the complaint window |
| 100,000 miles | 9.2 years — past the complaint window |
| 150,000 miles | 13.9 years — past the complaint window |
| 200,000 miles | 18.5 years — past the complaint window |
Read the right-hand column against the table earlier on this page rather than against your instincts. The readings that make buyers most nervous are the ones furthest past the period when problems actually get reported.
Which means the six-figure odometer that makes buyers flinch usually sits on the far side of the window where trouble concentrates, not in front of it. If a design fault was going to produce a wave of complaints, that wave has already happened, been documented, and in many cases been recalled and fixed at the manufacturer’s expense. You are buying a car whose problems are on the public record rather than ahead of it.
This is the opposite of how mileage is normally framed, and it is the strongest practical argument for checking the records of the specific model year rather than reasoning from the dash. A nine-year-old car with a clean complaint history and a nine-year-old car with a notorious one carry the same odometer reading and are not remotely the same purchase.
When low mileage is the warning rather than the reassurance
The mirror of the high-mileage worry gets far less attention and deserves more. Rubber perishes, seals dry, brake fluid absorbs water and fuel degrades on a calendar, not on an odometer. A twelve-year-old car with 40,000 miles has twelve-year-old consumables and has not had the compensating benefit of being run.
There is also the records problem. Mileage far below the average for the model year is the single most recognizable signature of odometer fraud, which is why the arithmetic above is worth doing in both directions. A car that reads implausibly low against its age is a car whose title history is worth examining before its paint is.
Where the odometer genuinely is decisive
None of this makes mileage worthless. It makes it a narrow instrument that is good at a few specific jobs.
- 1Checking the number against itselfCompare the reading with the model year, with any earlier readings on record, and with the wear on the pedals, steering wheel and driver's seat bolster. Consistency is what you are testing, not the value.
- 2Working out what warranty is leftManufacturer coverage is written as a term and a mileage, whichever comes first. Here the odometer is decisive because the contract says so — and the in-service date rather than the model year starts the clock.
- 3Judging the price, not the carValuation guides weight mileage heavily, which means the number moves what you should pay even when it says little about what you are buying. Those are separate questions and worth keeping separate.
- 4Reading the service intervalTiming belts, transmission fluid and spark plugs are specified by mileage. What matters is not the total but whether the intervals that have already passed were actually done.
The questions that replace the number
If the odometer will not answer the question, something has to. These will, and all of them can be settled before you spend anything.
- What does this exact model year's complaint record look like, against the other years of the same nameplate?
- Which component draws the most reports on this vehicle, and at what age do those reports cluster?
- Are there open safety recalls against this VIN — the repair is free from a franchised dealer, and an open recall is the seller's problem you are about to inherit.
- Does the mileage make sense against the model year and against the wear you can see?
- Were the mileage-specified services actually performed, with invoices rather than assurances?
- How much factory coverage is left, measured from the in-service date rather than the model year?
Every one of those is a question about a specific vehicle rather than about used cars in general, which is the actual reason no mileage threshold works. The threshold is an attempt to answer a question about one car using a statistic about all cars.
Where this information comes from
- NHTSA — complaints by vehicle (public API)The complaint record structure: date of incident, components, narrative — and no mileage field
- FHWA Highway Statistics 2024 — Table VM-1Annual vehicle distance traveled by vehicle type. The figures are in the linked workbook, not on the page — 10,812 miles per light-duty short-wheelbase vehicle
- NHTSA recall lookupOpen recalls against a VIN, free — the check worth running before the test drive
- NHTSA — odometer fraudWhy an implausibly low reading is a records question, not an inspection question
Keep reading
Frequently asked questions
How many miles is too many for a used car?
There is no threshold that survives contact with the evidence, and the reason is structural: the federal complaint database does not record mileage at all. Every one of the 1,400-plus complaint records on a single popular model year carries a date of incident and no odometer field. The largest public record of what goes wrong on American cars is organized by age, which is a strong hint about which variable actually tracks trouble.
What is the average miles per year for a car?
10,812 miles, for a light-duty short-wheelbase vehicle — cars, crossovers and small SUVs. That is the Federal Highway Administration's own figure from Table VM-1 of Highway Statistics, 2024 edition, computed across 205,550,881 registered vehicles. It is lower than the 12,000 to 15,000 that circulates as a rule of thumb, and it changes from year to year: the 2023 edition put it at 11,026.
Is 12,000 miles a year normal?
It is above the published average rather than at it. The rule of thumb has been repeated unchanged for decades while the measured figure has drifted, and for 2024 the measured figure is 10,812. If you are judging whether a car's odometer is plausible for its age, the gap matters — testing against 12,000 or 15,000 makes a great many perfectly ordinary vehicles look suspiciously low-mileage.
Is 100,000 miles too much for a used car?
Not on its own, and the arithmetic is worth doing. At the Federal Highway Administration's published average of 10,812 miles per light-duty vehicle per year, a 100,000-mile car is about 9.2 years old. Across the model years in our NHTSA extract, the single most-reported component on a vehicle draws its complaints at a median age of about 4.6 years. A car at 100,000 average miles is past that window, not approaching it.
Is 200,000 miles too many?
It is the point at which the odometer stops being the interesting question and the maintenance record becomes the only one. A vehicle that reaches 200,000 miles has almost always had major work done, and what you are buying is the quality of that work. Ask for the invoices rather than reasoning from the number on the dash.
Are highway miles better than city miles?
The claim is repeated everywhere and it is not something the public records can confirm or deny, because nothing in the federal complaint database records how a vehicle was driven. Treat it as a plausible mechanical argument rather than an established fact, and note that a seller has an obvious incentive to describe a high-mileage car as a highway car.
Is a low-mileage older car a good buy?
Sometimes, and sometimes it is the trap. Rubber, seals, fluids and brake hydraulics age on a calendar whether or not the car moves, and a vehicle that sat is a vehicle whose consumables aged without the compensating benefit of being exercised. Unusually low mileage for the model year is also the single most common signature of odometer fraud, which is a records question rather than an inspection question.
Start with the VIN, not the odometer
Decode any VIN free for the factory build, specifications and open safety recalls. No account, no card. Full vehicle history reports are launching soon.
Run a free VIN check