The short answer
- How do you work out gas mileage?
- Miles driven divided by gallons added at the next fill. Use the pump reading, not the trip computer, and measure across a full tank rather than a single trip.
- Why is the sticker number higher than yours?
- It comes from five laboratory cycles run on a dynamometer at a controlled temperature, with the air conditioning off for three of them. It is a comparison standard, not a prediction of your week.
- What is the single most useful thing to know?
- Miles per gallon compresses at the top end. Gallons per hundred miles does not, and it is the figure that tells you what a change is actually worth.
5
EPA test cycles
City, highway, high speed, A/C, cold
21.2 mph
The city cycle's average speed
23 stops in 11 miles
0.55/0.45
Combined weighting
Harmonic, per 40 CFR 600.210-12
15%–20%
Of results EPA re-tests
Manufacturers run the rest
The easy part, done right
Gas mileage is one division: miles traveled divided by gallons burned. There is nothing else in it, and every calculator that claims to do this is doing exactly that. What separates a useful measurement from a useless one is not the arithmetic but the two quantities you feed it, and both are easier to get wrong than they look.
The gallons figure has to come from the pump. A tank is refilled to a level, not to a volume, so the only reliable way to know how much fuel a stretch of driving consumed is to fill to the same point at the start and the end and read the second receipt. That number is the fuel you used. The trip computer’s estimate is a calculation from injector duty cycle and airflow, and it is designed to be smooth rather than exact.
The miles figure has to cover the same stretch. A single trip is too short a sample — one cold start or one traffic jam moves it several miles per gallon — so measure across a whole tank, and preferably several. Anything less is measuring the drive rather than the car, which is a real thing to want to know but not the same question.
Why you are not allowed to average two MPG figures
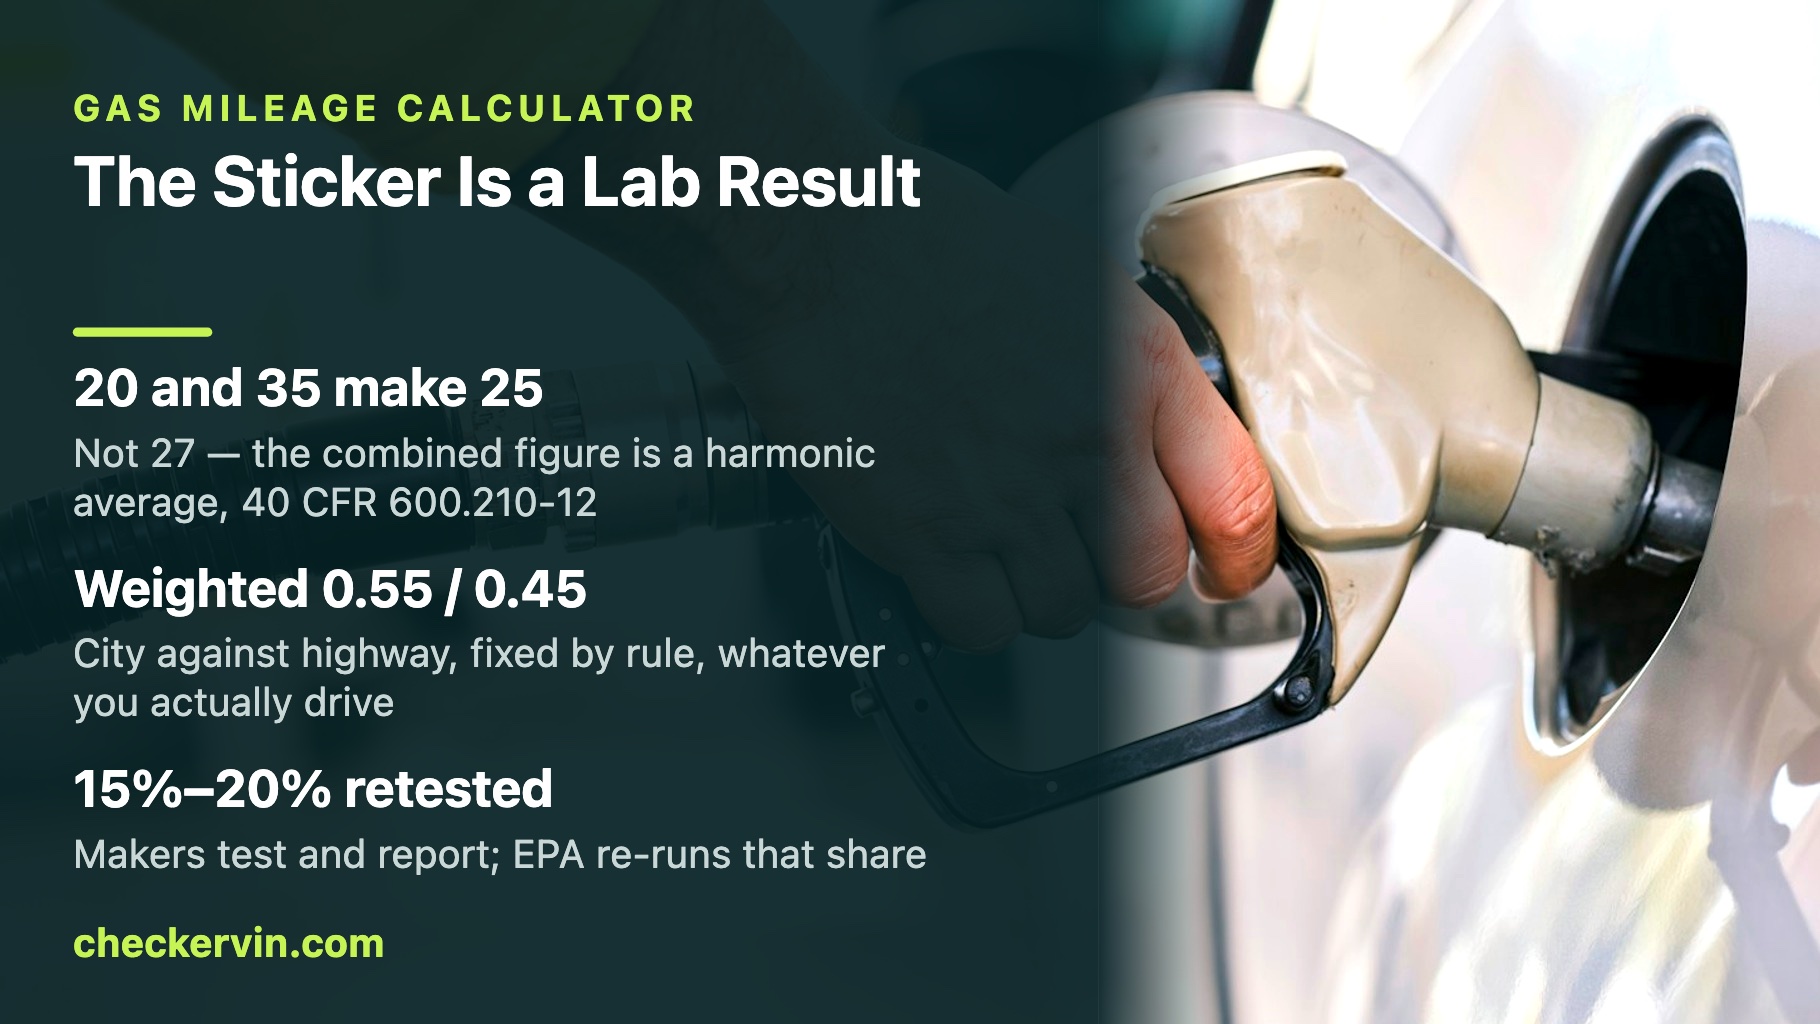
Here is a rule that surprises almost everybody: you cannot take a car’s city rating and its highway rating, average them, and get its combined rating. The federal regulation that defines the label figure knows this and says so. Under 40 CFR § 600.210-12(c)(1)(i), the manufacturer must “harmonically average the unrounded city and highway fuel economy values … weighted 0.55 and 0.45 respectively.”
Harmonically. Not the ordinary average everyone reaches for. Take a car rated 20 mpg in the city and 35 on the highway:
| Method | Result |
|---|---|
| Ordinary average | 0.55 × 20 + 0.45 × 35 = 26.8 mpg → 27 mpg |
| Harmonic average | 1 ÷ (0.55/20 + 0.45/35) = 24.8 mpg → 25 mpg |
| The difference | 2 mpg, and the regulation requires the lower one |
The reason is that miles per gallon is a ratio with the thing you care about — fuel — in the denominator. You do not drive a fixed number of gallons in each condition; you drive a fixed mix of miles. So the quantity that adds up cleanly is gallons per mile, and the harmonic mean of mpg is precisely the arithmetic mean of gallons per mile, turned back the right way up. The regulation is not being fussy. The ordinary average is simply the wrong operation, and it always errs in the flattering direction.
This is not a curiosity confined to window stickers. Any time you average mpg — across two cars in a household, across a fleet, across a mixed week of commuting — the ordinary average overstates the result, and it overstates it most when the two numbers are far apart.
The three-mpg gain that beats a ten-mpg gain
The same property of the unit produces a consequence with real money attached, and it is the single most useful thing on this page. Because fuel sits in the denominator, equal-sized steps in mpg are not equal-sized savings. Steps at the bottom of the scale are worth far more than steps at the top.
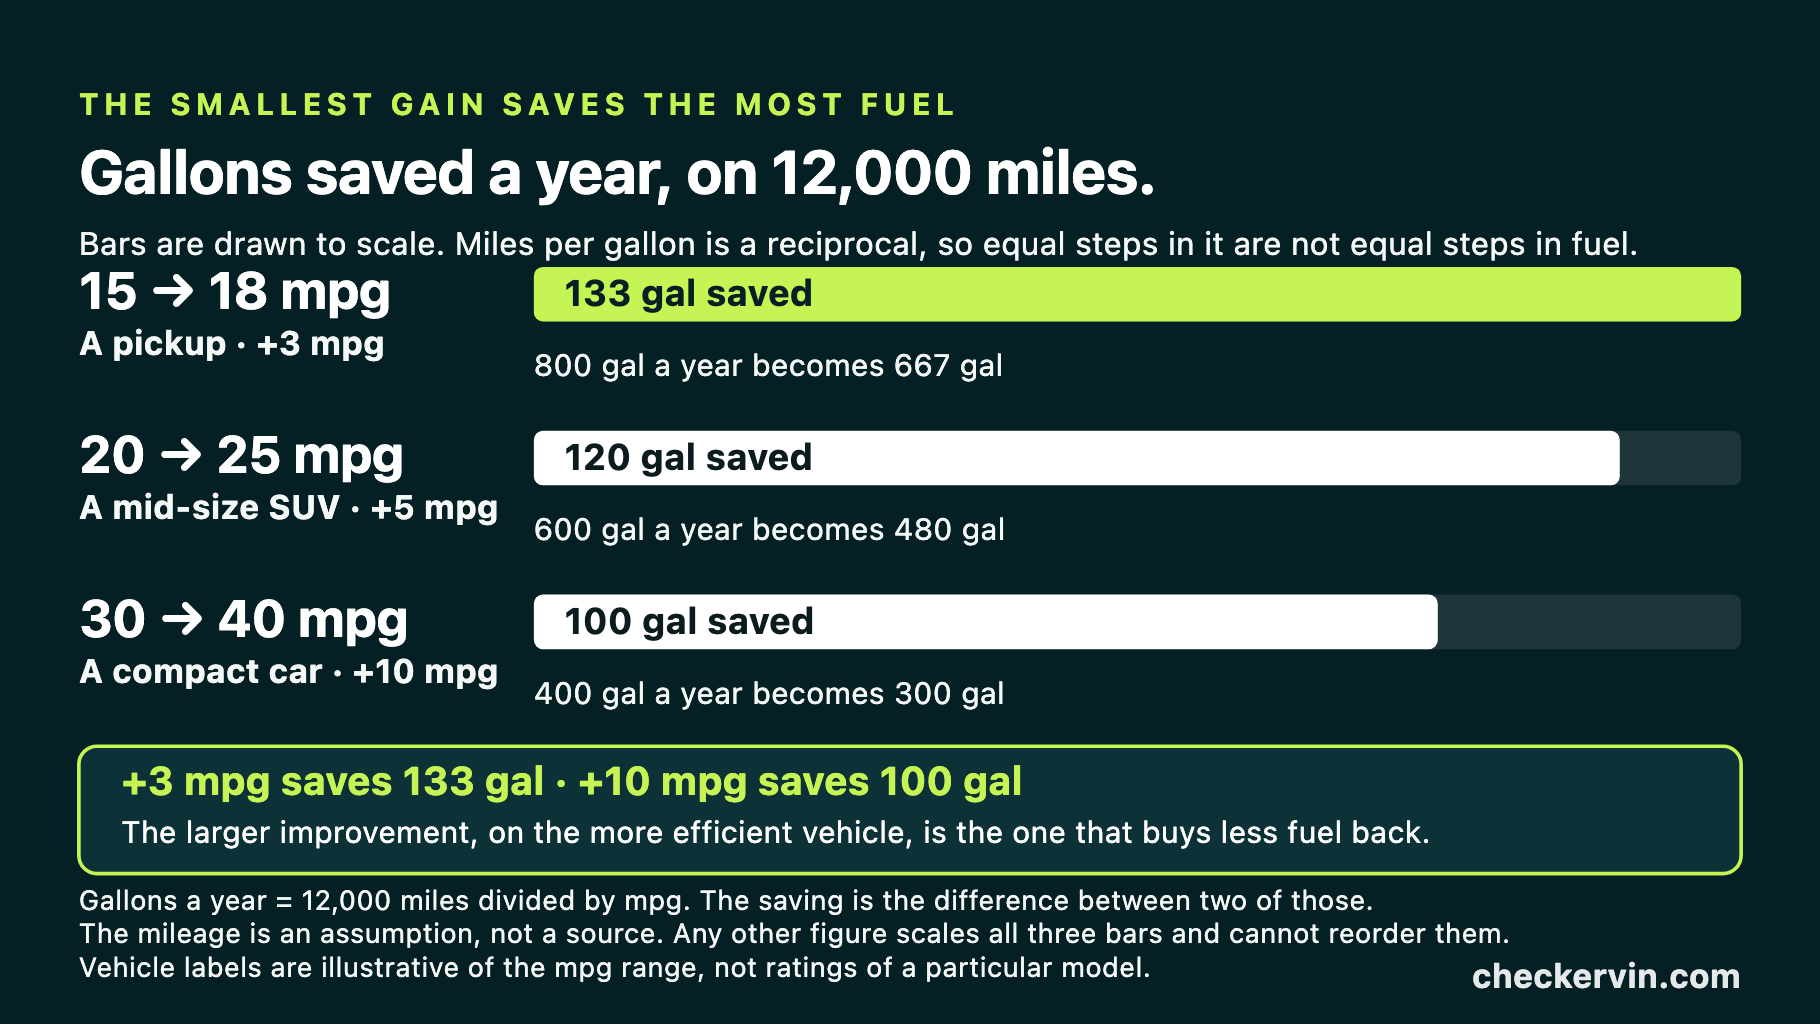
Over 12,000 miles a year:
| Improvement | Fuel saved over a year |
|---|---|
| 15 → 18 mpg | A pickup: +3 mpg saves 133 gallons |
| 20 → 25 mpg | A mid-size SUV: +5 mpg saves 120 gallons |
| 30 → 40 mpg | A compact car: +10 mpg saves 100 gallons |
Read those two outer rows against each other. Lifting a pickup from 15 to 18 mpg — a gain of 3 — saves 133 gallons a year. Lifting a compact from 30 to 40 — a gain of 10, more than three times as large — saves only 100 gallons. The smaller improvement to the thirstier vehicle wins, and it is not close.
Nothing about that is a paradox once you stop reading mpg as though it were a linear score. Turn the ratio over and it becomes obvious:
| Rated economy | Fuel burned per 100 miles |
|---|---|
| 15 mpg | 6.67 gallons |
| 20 mpg | 5.00 gallons |
| 25 mpg | 4.00 gallons |
| 30 mpg | 3.33 gallons |
| 40 mpg | 2.50 gallons |
| 50 mpg | 2.00 gallons |
The gap between 15 and 20 mpg is 1.7 gallons per hundred miles. The gap between 40 and 50 — a larger jump in mpg — is only 0.5 gallons. Most of the world outside the United States prints consumption in this direction for exactly this reason, and when you are comparing two vehicles it is worth doing the conversion in your head before you let the mpg figures decide anything.
What the sticker actually measured
The figure on a window sticker is not an estimate of your driving. It is the result of a defined set of laboratory procedures, run on a dynamometer, and the EPA publishes the specification of every one of them. There are five.
| Cycle | What it runs |
|---|---|
| City — FTP | Low speeds in stop-and-go urban traffic · top 56 mph, average 21.2 mph · 11 miles in 31.2 min · 23 stops, idling 18% of the time · Cold start at 68–86 °F · A/C off |
| Highway — HWFET | Free-flow traffic at highway speeds · top 60 mph, average 48.3 mph · 10.3 miles in 12.75 min · no stops · Warm start at 68–86 °F · A/C off |
| High speed — US06 | Higher speeds, harder acceleration and braking · top 80 mph, average 48.4 mph · 8 miles in 9.9 min · 4 stops, idling 7% of the time · Warm start at 68–86 °F · A/C off |
| Air conditioning — SC03 | A/C use under hot ambient conditions · top 54.8 mph, average 21.2 mph · 3.6 miles in 9.9 min · 5 stops, idling 19% of the time · Warm start at 95 °F · A/C on |
| Cold temperature | The city cycle again, in the cold · top 56 mph, average 21.2 mph · 11 miles in 31.2 min · 23 stops, idling 18% of the time · Cold start at 20 °F · A/C off |
Read the city cycle’s numbers as a description of a journey and the shape of the problem appears immediately. It covers 11 miles in 31.2 minutes at an average of 21.2 mph, with 23 stops and the engine idling 18% of the time. That is a careful, unhurried version of city driving. The highway cycle is more revealing still: it tops out at 60 mph, averages 48.3, and never stops once in 10.3 miles.
Three of the five cycles are run with the air conditioning off, and four of the five at a lab temperature between 68–86 °F. The two that break that pattern exist precisely because the others do not resemble a hot afternoon or a January morning — SC03 runs the city cycle at 95 °F with the compressor on, and the cold-temperature test repeats the city cycle at 20 °F.
Who runs the test
One detail changes how people read a window sticker, and it is stated plainly on fueleconomy.gov: manufacturers test their own vehicles — usually pre-production prototypes — and report the results to EPA. The agency reviews what it is sent and confirms about 15%–20% of the results through its own testing at the National Vehicles and Fuel Emissions Laboratory.
That is not a scandal and it is not hidden; it is how a great deal of product regulation works, and the audit share is high enough to make misreporting a poor idea. But it does reframe the number. The sticker is a regulated, standardized, partially verified self-report produced on a pre-production example of your model, at a controlled temperature, on rollers. Every one of those qualifiers is a reason your car might read differently, before anything is wrong with it at all.
Why your number is lower, and by how much
The EPA publishes its own account of what moves real-world fuel economy away from the rating. These are its figures, quoted as printed, and several are much larger than people expect.
| Factor | What fueleconomy.gov attributes to it |
|---|---|
| Aggressive driving | 15% to 30% at highway speeds, and 10% to 40% in stop-and-go traffic |
| Air conditioning | roughly 5%–25% compared with not using it |
| 10% ethanol in the gasoline | 3%–4%, because ethanol carries less energy per gallon |
| Reformulated or oxygenated fuels | 1%–3% |
| Winter-blend gasoline | summer conventional gasoline holds about 1.7% more energy per gallon |
| A new engine still bedding in | 3–5 thousand miles before fuel economy settles |
The first row is the one that matters most and the one drivers are least willing to accept. Speeding, rapid acceleration and hard braking are credited with 15% to 30% at highway speeds and up to 40%in stop-and-go traffic — a larger effect than anything mechanical on the list, available for free, and entirely within the driver’s control.
The EPA also lists factors it does not put a number against, and their absence from the table above is deliberate rather than an oversight: cold weather and frequent short trips, underinflated or misaligned tires, brake drag, excessive idling, roof racks and cargo, towing and extra weight, engaged four-wheel drive, hills, and unpaved roads. All of them cost fuel. None of them has a published percentage attached, so this page does not invent one.
Finding the EPA record that is actually yours
A fair amount of confusion about fuel economy is really confusion about which car is being discussed. The EPA’s database is organized by model year, make, model, engine and transmission — not by VIN — and a single nameplate in a single year routinely carries several ratings. Two engines, two transmissions and an all-wheel-drive option produce up to eight distinct records, and they do not have similar numbers.
This is where the seventeen characters earn their place on a page about fuel. A VIN decode returns the engine, the displacement, the fuel type, the drive type and the body class the vehicle was actually built with, which is exactly the set of fields you need to land on the right EPA record instead of the one at the top of the search results.
- Engine and displacement — the field that most often splits one model into several ratings
- Transmission type — manual and automatic versions of the same engine are rated separately
- Drive type — front, rear or all-wheel drive changes the rating and is easy to assume wrongly
- Fuel type — including flex-fuel variants, which carry a second rating for E85
- Body class and model year — the coordinates the EPA database is indexed on
Our engine size by VIN page covers the decode field by field, and transmission by VIN covers the other half of the split.
Decode the VIN to find your exact configuration
Decoded from official manufacturer and NHTSA records
Measuring your own, properly
- 1Fill to the click and write down the odometerNot to the brim, not topped off — to the first automatic shut-off. Consistency between the two fills matters far more than which point you choose, because the error cancels only if you repeat it.
- 2Drive the tank normallyResist the temptation to drive gently for the measurement. A number produced by driving you will not repeat is a number about a person who does not exist.
- 3Refill at the same pump, to the same clickSame station and same pump if you can manage it. Shut-off sensitivity varies between nozzles, and that variation is a direct error in your gallons figure.
- 4Divide miles by the gallons on the receiptOdometer difference over gallons added. That is your mpg for the tank, and it is a real measurement rather than an estimate.
- 5Repeat for three or four tanks before believing itWeather, traffic and the fuel blend all move a single tank by a wide margin. The average across several is the figure worth comparing with anything.
- 6Compare against the right EPA record, not the headline oneMatch the engine, transmission and drive type from the VIN decode first. Comparing your four-cylinder front-drive car with the published figure for the V6 all-wheel-drive version explains a great many disappointing results.
When falling fuel economy is a symptom
Everything above concerns a car that is working properly. Fuel economy is also a diagnostic instrument, and it is a sensitive one, because an engine that is compensating for a fault usually pays for it in fuel before it pays for it in any way you can hear.
The signal to watch is not the absolute figure but the change. A car that has returned 26 mpg for two years and now returns 22 is telling you something specific; a car that has always returned 22 against a 26 rating is telling you about your commute. The first is worth investigating and the second is not.
- A sudden drop with no change in route or season — the classic profile of a sensor reporting badly rather than a part failing outright
- A drop that arrives with a check-engine light — the stored code narrows it enormously and reading it is free
- A gradual decline over years — usually tires, alignment, brake drag and accumulated deferred maintenance rather than one fault
- A shortfall from the day you bought a used car — worth separating from the previous owner's habits by measuring several tanks yourself
- A shortfall alongside odometer readings that do not run forward across the title record — a different problem entirely, and a serious one
On a used car the second and last items are the ones to take seriously. A stored fault code is cheap information — our OBD-II code guide covers how to read one and how to judge what it means — and a history of odometer readings that do not increase monotonically undermines every mileage-based figure you have, fuel economy included. That one is covered on our odometer rollback check page.
Where this information comes from
- fueleconomy.gov — detailed test informationThe Test Cycle Attributes table: every speed, distance, stop count and lab temperature quoted above
- fueleconomy.gov — how vehicles are testedManufacturers test their own pre-production vehicles; EPA confirms about 15%–20% of results
- fueleconomy.gov — factors that affect fuel economyThe EPA's own percentages for aggressive driving, air conditioning, ethanol content and fuel blends
- 40 CFR § 600.210-12 — calculation of fuel economy label valuesThe harmonic average, weighted 0.55 city and 0.45 highway
- NHTSA — vPIC VIN decoderThe federal decode that returns the engine, transmission and drive type behind your EPA record
Keep reading
Frequently asked questions
How do you calculate gas mileage?
Fill the tank, note the odometer, drive, then fill it again at the same pump to the same click. Miles traveled divided by gallons added is your mpg for that tank. The second fill is the measurement — the gallons on the receipt are the gallons you actually burned.
Why is my gas mileage worse than the EPA estimate?
Because the window sticker is a laboratory figure and your commute is not a laboratory. The EPA's city cycle averages 21.2 mph with 23 stops in 11 miles at a lab temperature of 68–86 °F; the highway cycle never stops at all. fueleconomy.gov attributes 15%–30% of the gap at highway speeds to aggressive driving alone, and another 5%–25% to running the air conditioning.
How is the combined MPG figure calculated?
Under 40 CFR § 600.210-12 the combined label value is a harmonic average of the city and highway figures, weighted 0.55 and 0.45, rounded to the nearest whole mpg. A harmonic average, not an ordinary one — which is why a 20 city / 35 highway car is rated 25 combined rather than the 27 you would get by averaging the two numbers directly.
Who actually performs the EPA fuel economy test?
The manufacturer. fueleconomy.gov states that manufacturers test their own vehicles — usually pre-production prototypes — and report the results to EPA, and that EPA confirms about 15%–20% of them through its own tests at the National Vehicles and Fuel Emissions Laboratory. The number on the sticker is a regulated, audited self-report.
Can I look up gas mileage by VIN?
Not directly — the EPA's fuel economy database is keyed to year, make, model, engine and transmission rather than to individual VINs. What the VIN does is tell you which of those records is yours. On a model sold with three engines and two drivelines, that is the difference between six published ratings, and guessing is how people end up comparing their car with a different one.
One model, several ratings — find yours
Decode any VIN free for the engine, transmission, drive type and open safety recalls. No account, no card.
Run a free VIN check